Systems-level thought for making progress in PSHA
Richard Styron
This text is slightly adapted from a lecture I gave at Oxford in June 2022.
In PSHA, we are seeking to characterize the behavior of a system. In regional PSHA, we are looking at a system of seismic sources (typically faults and background sources), as well as a heterogeneous lithosphere and its irregular surface, where we want to calculate the effect of seismic waves generated by the sources. For a site-specific or scenario-based analysis, we are cutting down on the dimensionality of the problem in some capacity but we may be adding more depth or complexity of analysis for whatever parts of the system that we are analyzing.
The different components of the system are interactive, and to do the best job possible we have to be able to describe each component and understand how it interacts with other components. Working in this manner is different than considering the components in isolation, as is often done, but this presents opportunities in addition to challenges, because we can use system-level constraints such as budgets to reduce uncertainties and to make inferences where measurements are difficult or otherwise lacking.
A simple and useful example of systems-level thinking in PSHA is characterizing seismicity rates in an area through consideration the Gutenberg-Richter distribution. Regional seismicity is well known to follow a Gutenberg-Richter distribution through the moderate to large magnitudes, though microseismicity and megaseismicity may behave differently, and are challenging to observe in any case. Within our magnitude bounds, and within our study area, we may not be able to precisely measure the rate of Magnitude 6.2 earthquakes, because our seismic catalog is only a few decades long, and maybe there actually haven't been any M 6.2 earthquakes in those decades. But there have been M 5.2 earthquakes, and M 6.0 earthquakes, and M 6.4 earthquakes, and M 7.1 earthquakes. By considering the rates of all of the earthquakes of different magnitudes, by fitting a Gutenberg-Richter magnitude-frequency distribution to the seismic catalog, we can estimate the rates of magnitude 6.2 earthquakes with a reasonably high degree of confidence even though we have few to no observations of their occurrence.
This process of inference is a model fitting procedure. We are using a model, described by an equation with some free parameters, and fitting that to a dataset. There is interaction between the different components of the data through their relative rates of occurrence, and this is mediated by the model. Without the model, the rates of occurrence of each event provides no information on the rates of occurrence of the other events. But the model is fit to the data, so changes in the occurrence rates of one magnitude affect the model's parameters, and therefore the estimated rates of the other magnitudes. There are tradeoffs because neither the data nor the model is perfect and known without uncertainty. All model fitting procedures seek to balance this tradeoff and minimize the misfit.
Block models provide another way of integrating data through system-level constraints. Block models group contiguous areas of crust, which are relatively rigid and move coherently. The blocks are separated by faults, which slip with the rate and kinematics of the relative motion of the blocks on either side of the fault. Therefore, block motions can be determined by geodetic data in the block interiors, which describe the motion of each block independently or absolutely in a common reference frame, or by fault slip rate data, which describe the relative motion of adjacent blocks at the measurement point. Block models, and other models of the kinematics of the surface of the Earth that also include faults, are therefore able to combine and synthesize both absolute and relative measurements of crustal movement.
What makes block models so valuable, though, is not just the ability to combine the different types of datasets, but to predict crustal motion at any point within the model, regardless of whether there are zero, one or many measurements nearby. This is incredibly useful for PSHA, because in making a PSHA model we need to characterize the behavior of the whole system, not just the components of the system that have seen previous investigation or that are deemed most interesting.
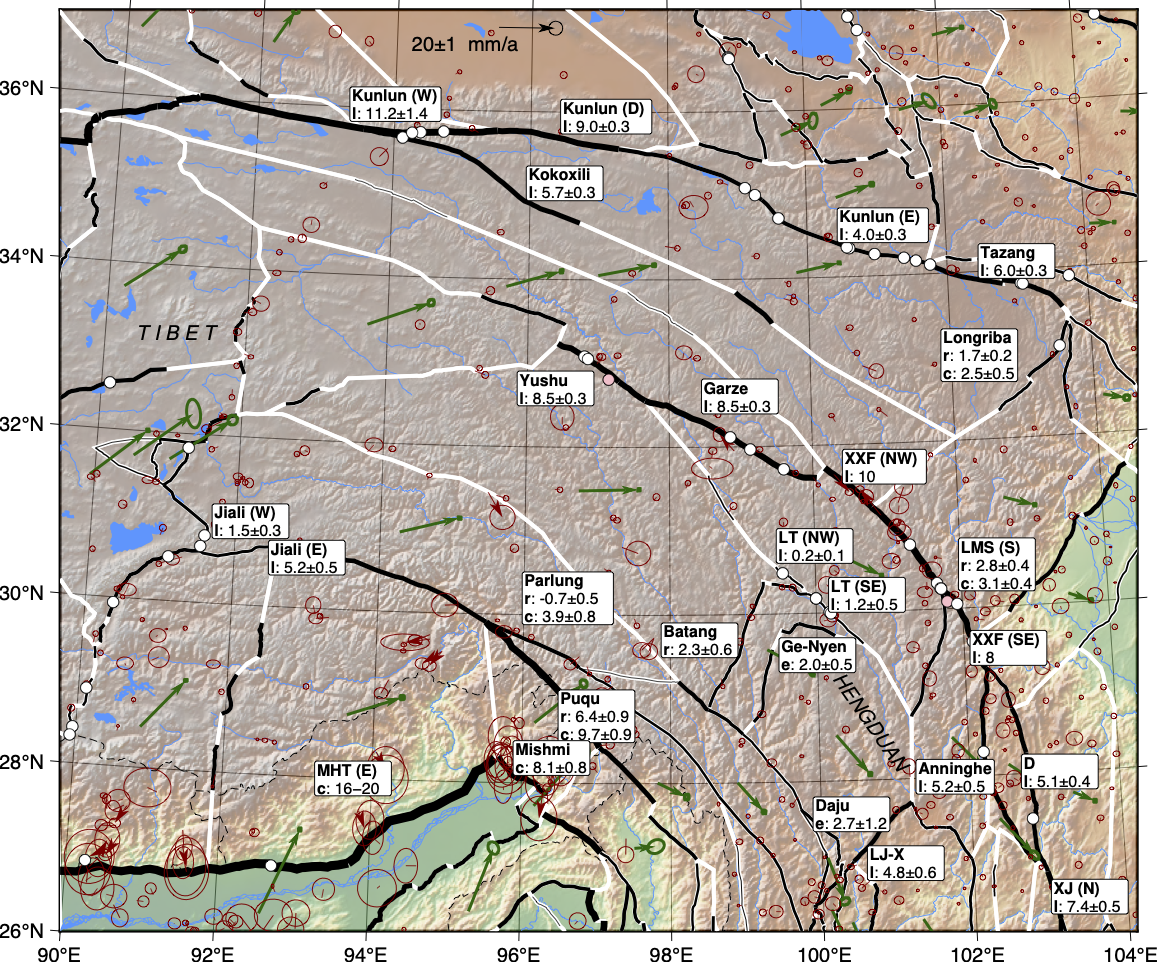
Active Tectonics of Eastern Tibet, from Styron, in review
Here we can see a map of eastern Tibet, with mapped faults shown in black, and geologic slip rates shown as white circles. As we can see, the slip rate measurements are concentrated on a few faults. Now, these faults are very impressive structures, some with slip around a centimeter per year, and accommodate a large portion of the famed but contentious deformation of the eastern margin of Tibet.
If you are a fault researcher or a tectonicist, and you see this map, what do you do? Do you say "it looks like I can maybe fit a dot in between two of those other two dots" and start packing your field gear? Probably not. In reality, you say "since the 1980s, the slip rate on these very important faults has been seen as the key to discriminating between rigid-block-style extrusion of Tibetan lithosphere in response to the Indo-Asian collision, or continuum-style growth and/or collapse of an overthickened orogen through lower crustal flow." Then you go pack your field gear to fit your dot in between two other dots. And you may not bother with these other faults, because you may think that they are not the key structures for unraveling Tibetan orogenic dynamics, and are therefore surely boring and unlikely to make you famous. Or maybe, you don't know about them because they're not in the figures of the other papers you read.
If you are responsible for building a hazard model of the region, and you don't have slip rates on all of these other faults, what do you do? Speculate about the rates on the other faults, and pick a number that doesn't sound too wrong, as I have done in the past? Leave them out completely so that everything in the model has empirical support and little is left to direct 'expert judgement'? Some in hazard do this. I think that the best way is to leverage other data sources and tectonic theory in order to estimate the rates that we are lacking.
Tectonic geodesy is typically a systems-level approach that measures deformation over a broad area, ideally with good spatial resolution. However, by itself it is not sufficient to serve as a seismic source model for PSHA. GNSS velocity fields must still be resolved on faults, or perhaps interpolated into a strain field (like with InSAR). This has to be processed with a number of assumptions to yield not only seismic moment release rates over the model domain, but the magnitudes, geometries and kinematics of the resulting earthquakes. This information is more typically derived from fault mapping and focal mechanism catalogs.
What geodesy does provide that is quite useful is a strain budget. Individual measurements may be wrong, but if data errors push one part of the velocity field too much, that will be compensated elsewhere, in order to fit in the total strain budget. This may also be evident in the resulting kinematics--too much contraction in one part of a model may cause extension in another part nearby, which won't match the kinematics inferred from fault and focal mechanism data. These properties of budgets and self-correction help ensure that we are not strongly under- or over-predicting seismic moment release rates.
The grand challenge here for us, to really make our research useful for PSHA, is to place it within a framework, or a system, that can serve to fully characterize some aspect of the PSHA model or the study area. Obviously this is easier for some data types or techniques than others. If you make regional earthquake catalogs, that is easy. Fault slip rates are also easy to incorporate into PSHA and can be very useful, particularly for understudied faults, but they become much more powerful within a block model or other system with a strain budget, because then one data point can help constrain other, unmeasured faults.
Paleoseismology is actually hard to fully incorporate into PSHA. At its most basic, it can confirm that a given fault is seismically active and therefore should be included in a PSHA model, which is honestly pretty nice. Beyond that, though, it gets tough without a good framework. The major hurdle is that in most of modern PSHA, the modeled seismicity on faults is defined by a slip rate and a generic magnitude-frequency distribution, and regional PSHA is almost always time-independent. Instead, paleoseismology primarily yields paleoearthquake ages ranges and sometimes recurrence intervals, which can't always be directly plugged in.
If you accept that faults can host earthquakes of variable magnitudes, at least more than 1 magnitude unit of variation, it becomes tough to incorporate earthquake time dependence and recurrence intervals into PSHA. If a fault can rupture with a M 7.2 earthquake, does a M 6.0 reset the clock of recurrence? Just a little bit? For the whole fault, or just the part of it that had the spatially smaller M 6.0? You need a good system or framework for this, a model that ties fault mechanics and probability theory to quantitative paleoseismology that can estimate paleorupture timing plus magnitudes and maybe spatial extents as well, in order to calibrate a time-dependent model, for just a single fault. Do we have such a framework? Not one that is widely accepted. Can we build one? Yes! And that is why we're here. And while we are at it, let's add multifault ruptures, dynamic triggering, and elastic and viscoelastic Coulomb stress changes to incorporate fault interaction.
So what about other techniques or measurement types? How can we systematize them, and include them in PSHA? How can we maximize the impact of individual data points? First, let's recognize that every single part of PSHA has assumptions and approximations and parameters that can be improved, and should be. Let's list some of these components, and talk about different techniques that yall specialize in, and how they can contribute.