A new open-source GIS file for active(?) low-angle normal faults
Richard Styron
TL;DR: I made a GIS file (SHP, KML, GeoJSON) of potentially-active low-angle normal faults. You can get it at github here, and contribute if you'd like.
I'm finishing up a project estimating the maximum likelihood of observing an earthquake on a low-angle normal fault (LANF). Basically, observations of LANF seismicity are pretty rare, and there is a reasonable amount of debate about the hows and whys of low-angle normal faults. A good summary by Gary Axen (who has probably devoted more research energy into this than anyone else) is at this open-access review paper (thanks, Geology!). Essentially, the maximum principal stress direction in an extensional environment should be pretty close to perpendicular to a low-angle normal fault plane, and fault friction has to be much lower than laboratory-derived values for fault friction in order for the fault to slip instead of a new, optimally-oriented fault to form. So it's not entirely clear how they slip, and whether they slip in sizeable earthquakes or creep aseismically.
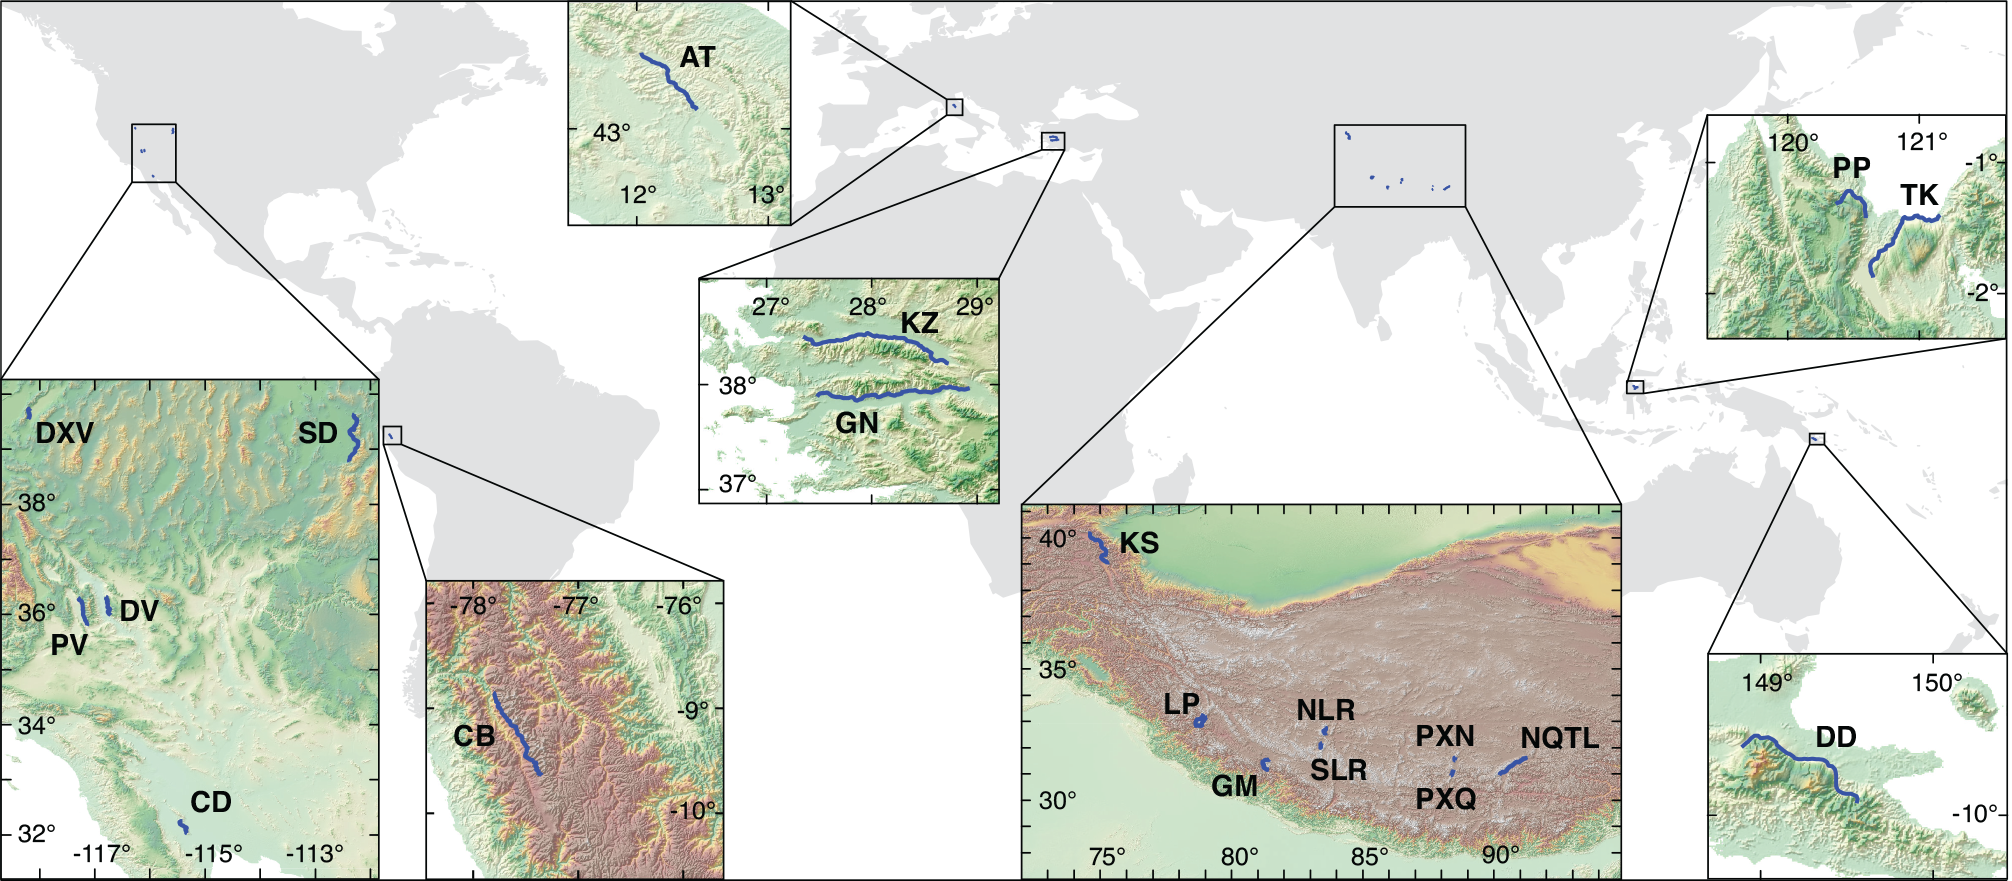
Here is the map of active LANF traces and their physiographic contexts. DXV=Dixie Valley fault. PV=Panamint Valley fault. DV=Death Valley fault. CD=Cañada David detachment. SD=Sevier Desert detach- ment. CB=Cordillera Blanca detachment. AT=Alto-Tiberina fault. KZ=Kuzey detachment. GN=Guney detachment. KS=Kongur Shan fault. LP=Leo Pargil detachment. GM=Gurla Mandhata detachment. NLR=North Lunggar detachment. SLR=South Lunggar detach- ment. PXN=Pum Qu–Xainza north fault. PXQ=Pum Qu–Xainza Qingdu fault. NQTL=Nyainqentanglha detachment. PP=Pompangeo detachment. TK=Tokorondo detachment. DD=Dayman Dome. Sources for faults are in the GIS metadata.
LANFs are well-described in the literature, but most of them are 'fossil' or inactive structures. There have been scattered descriptions here and there of active LANFs, some by me and my colleagues, but to date no one has really set down and sorted through the literature to find all of the potentially active ones. Many of the new ones to come to light are in Tibet, and by and large the Tibetan research community is more interested in historical geology and large-scale tectonics and geodynamics than fault mechanics, so the knowledge of these faults stays more localized with the Tibet workers than with the fault mechanics people (there is some knowledge diffusion here, but it's slow).
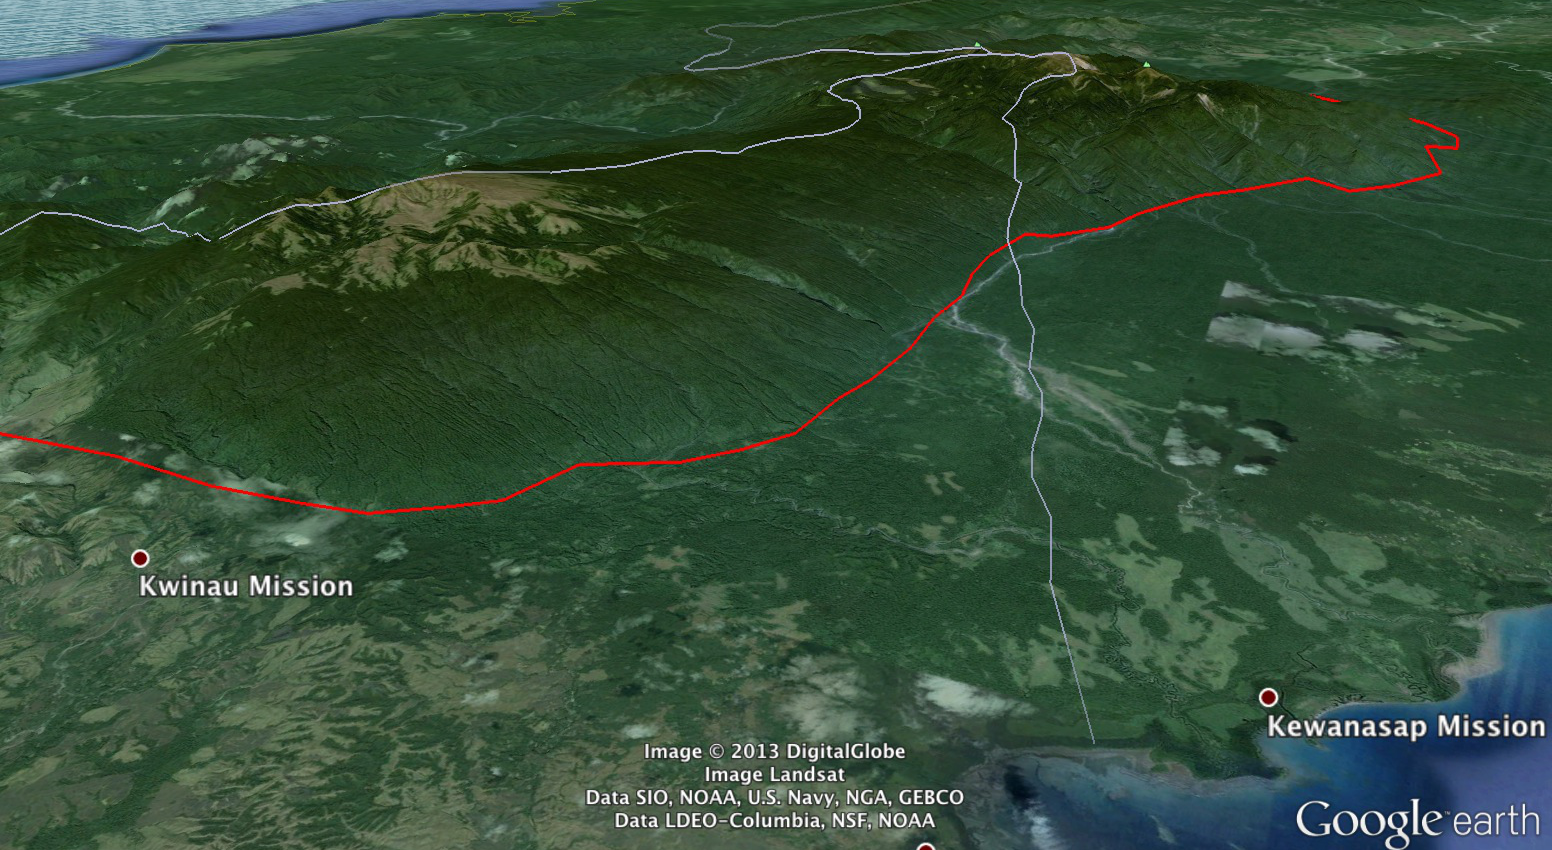
Google Earth view of the Mai'iu detachment (red) at the base of the Dayman Dome - Mt. Suckling core complex in the Owen Stanley range, Papua New Guinea
So in order for me to estimate the likelihood that these faults will rupture, I had to actually figure out where they are and what their dimensions are. I went through the literature, and mapped the traces on SRTM data. Most of them are in Tibet, which is no surprise given Roger Buck's ideas (expanded by many since) indicating that low-angle (in the upper crust at least) normal faults and metamorphic core complexes should form in areas of hot, thick crust which can flow at depth and allow for flexural rotation of the fault planes. This is handy because I know the Tibetan rift systems pretty well; some are poorly- described in the literature. I don't know that my search was quite as exhaustive for other areas of the globe. Hopefully, more people will have suggestions and we can keep this updated as information becomes available. The files are hosted in a GitHub repo, so you can do whatever you want with them.
I used some criteria for inclusion here: Basically, the faults have to be dipping less than 30° near the surface, and the fault trace has to be clear and subareal. There are a ton of examples at mid-ocean ridges which I couldn't map, because it's a big undertaking, and not really relevant for my initial purposes. If someone else has done it, then by all means, those contributions are welcome.
The file is in Esri Shapefile, Google Earth KML, and GeoJSON formats. The GeoJSON format is great because it's what a lot of web map apps use, and it can be read into Python really easily, and it's human-readable (in a way that KML just ain't). Plus GitHub has an auto-view thing of the GeoJSON in an embedded web app. Take a look!

