How to create topographic profiles in ArcGIS with x,y coordinates, and plot them with projected sample locations in Python
Richard Styron
This post was from my old blog, and was far and away the most 'popular' post in terms of pageviews, etc. It has received minor formatting changes.
I have been getting a lot of zircon (U-Th)/He cooling data these past couple of weeks from my South Lunggar project, and placing that data in a proper structural context for interpretation. This involves drawing cross-sections and projecting my sample locations onto those cross-sections, which requires a topographic profile (drawn with no vertical exaggeration) that has proper geographic or projected coordinates. Though this is a task that most geologists (especially structure/tectonics types) will have to do at some point, there is not a lot of information out there for doing it with modern tools.
Getting a georeferenced topo profile is a bit of a pain. It should be easy to do it simply in Arc but it’s not. The point projection is less of a pain, although it still requires a bit of work. If anyone else knows a quicker way to do this, I’d love to know, so share away!
I am doing this in ArcGIS 10; this also requires XToolsPro, which does nominally cost money although without paying the program still works after the trial period, and I think works for most recent versions of Arc. I am also using Python (with matplotlib) to do the plotting. It could be done in MATLAB very easily, for those with a copy.
Part 1: Generate the topographic profile
Step 1: Make the line
Create a polyline shapefile in ArcToolbox
Edit the line in ArcMap and draw the line.
It’d probably be helpful to have the DEM loaded.
Step 2: Make a raster out of the line
In ArcToolbox, –> Conversion Tools –> To Raster –> Polyline to Raster
It seems reasonable to use the same cell size as your DEM but you probably don’t have to.
Step 3: Make points out of every cell in the raster
In ArcToolbox, –> Conversion Tools –> From Raster –> Raster to Point
Make sure you input the line raster, not the DEM.
Step 4: Get elevation values for the points (add to attribute table)
ArcToolbox –> Spatial Analyst Tools –> Extraction –> Extract Values to Points
Step 5: Get X,Y coordinates for the points (also add to attribute table)
XToolsPro –> Table Operations –> Add X,Y,Z coordinates
I like to add both UTM and Lon/Lat (WGS84) coordinates to my attribute table. This requires doing the operation twice, which is trivial. In any case, you need some sort of projected coordinate system so that you can plot the profile with meters on both axes, so UTM is good.
Step 6: Calculate the distance along the profile of every point
Open up the .dbf file (basically the attribute table) of the point shapefile in your favorite spreadsheet program, and find the distance from the start for each point using the Pythagorean theorem. To be safe, save this file as a new spreadsheet file instead of saving the .dbf.
To plot it with the code I will show below, export the file as a .csv and delete the header row, so that it is only columns of numbers.
Part 2: Project sample locations onto the cross-section
This assumes you have a spreadsheet that has all of your samples with some sort of X,Y,Z coordinates. If you only have X and Y, you can get Z with the values to points step outlined in Step 4 after you have made a shapefile out of the spreadsheet.
Step 1: Import sample data into ArcMap
In ArcMap, File –> Add data –> Add XY data
This will plot the points as ‘events’ without them having the proper attributes to continue, so you have to…
Step 2: Make the points into a shapefile
Right click on the sample file in the Table of Contents in ArcMap, and go to Data –> Export Data and make a shapefile out of it.
Step 3: Add UTM coordinates to shapefile (if they’re not there yet)
Same as Step 4 above.
Step 4: Project points onto cross-section
This is basically finding the along-section distance of the points. It assumes that the points will project to the nearest point of the profile, not along strike (if your section line is not strike-normal).
First, find the best-fit line of the UTM Easting and Northing coordinates from your section line. I did this by plotting them in Excel and fitting a trendline. This line will have the form y = mx+b.
Then, open the .dbf file from your sample shapefile in Excel.
Now, project a sample from location (c,d) onto the cross-section, so that the projection is at (x,y):
$ x = (md + c – mb) / (m^2 + 1) $
$ y = (m^2 *d + mc + b) / (m^2 + 1) $
Then, calculate the distance along the projection for that point using the Pythagorean theorem as in Step 6 above.
Finally, export the file as a .csv and delete the header row, if you have one.
Part 3: Plotting it all up
I have been using Python’s matplotlib to make these plots, as I’m slowly working towards moving to Python from MATLAB. Instead of step-by-step descriptions of how to do things, I am going to simply post a snippet of my code, which should be commented enough that any Python user should get the gist of it:
# import libraries
import matplotlib.pyplot as plt
import csv
# import topo data from excel csv file in columns
f = csv.reader(open(‘topo_profile_gsa.csv’))
xDist_tuple, elev_tuple = zip(*f)
# convert tuples into float lists
xDist = [float(i) for i in xDist_tuple]
elev = [float(i) for i in elev_tuple]
# import thermo data from excel
g = csv.reader(open(‘C:\\school\\tibet\\lunggar\\thermo\\nmtProj.csv’))
UTMEastSample_tuple, UTMNorthSample_tuple, elevSample_tuple, xDistSample_tuple, zHeAge_tuple, zHeErr_tuple, sampleName = zip(*g)
UTMEastSample = [float(i) for i in UTMEastSample_tuple]
UTMNorthSample = [float(i) for i in UTMNorthSample_tuple]
elevSample = [float(i) for i in elevSample_tuple]
xDistSample = [float(i) for i in xDistSample_tuple]
zHeAge = [float(i) for i in zHeAge_tuple]
zHeErr = [float(i) for i in zHeErr_tuple]
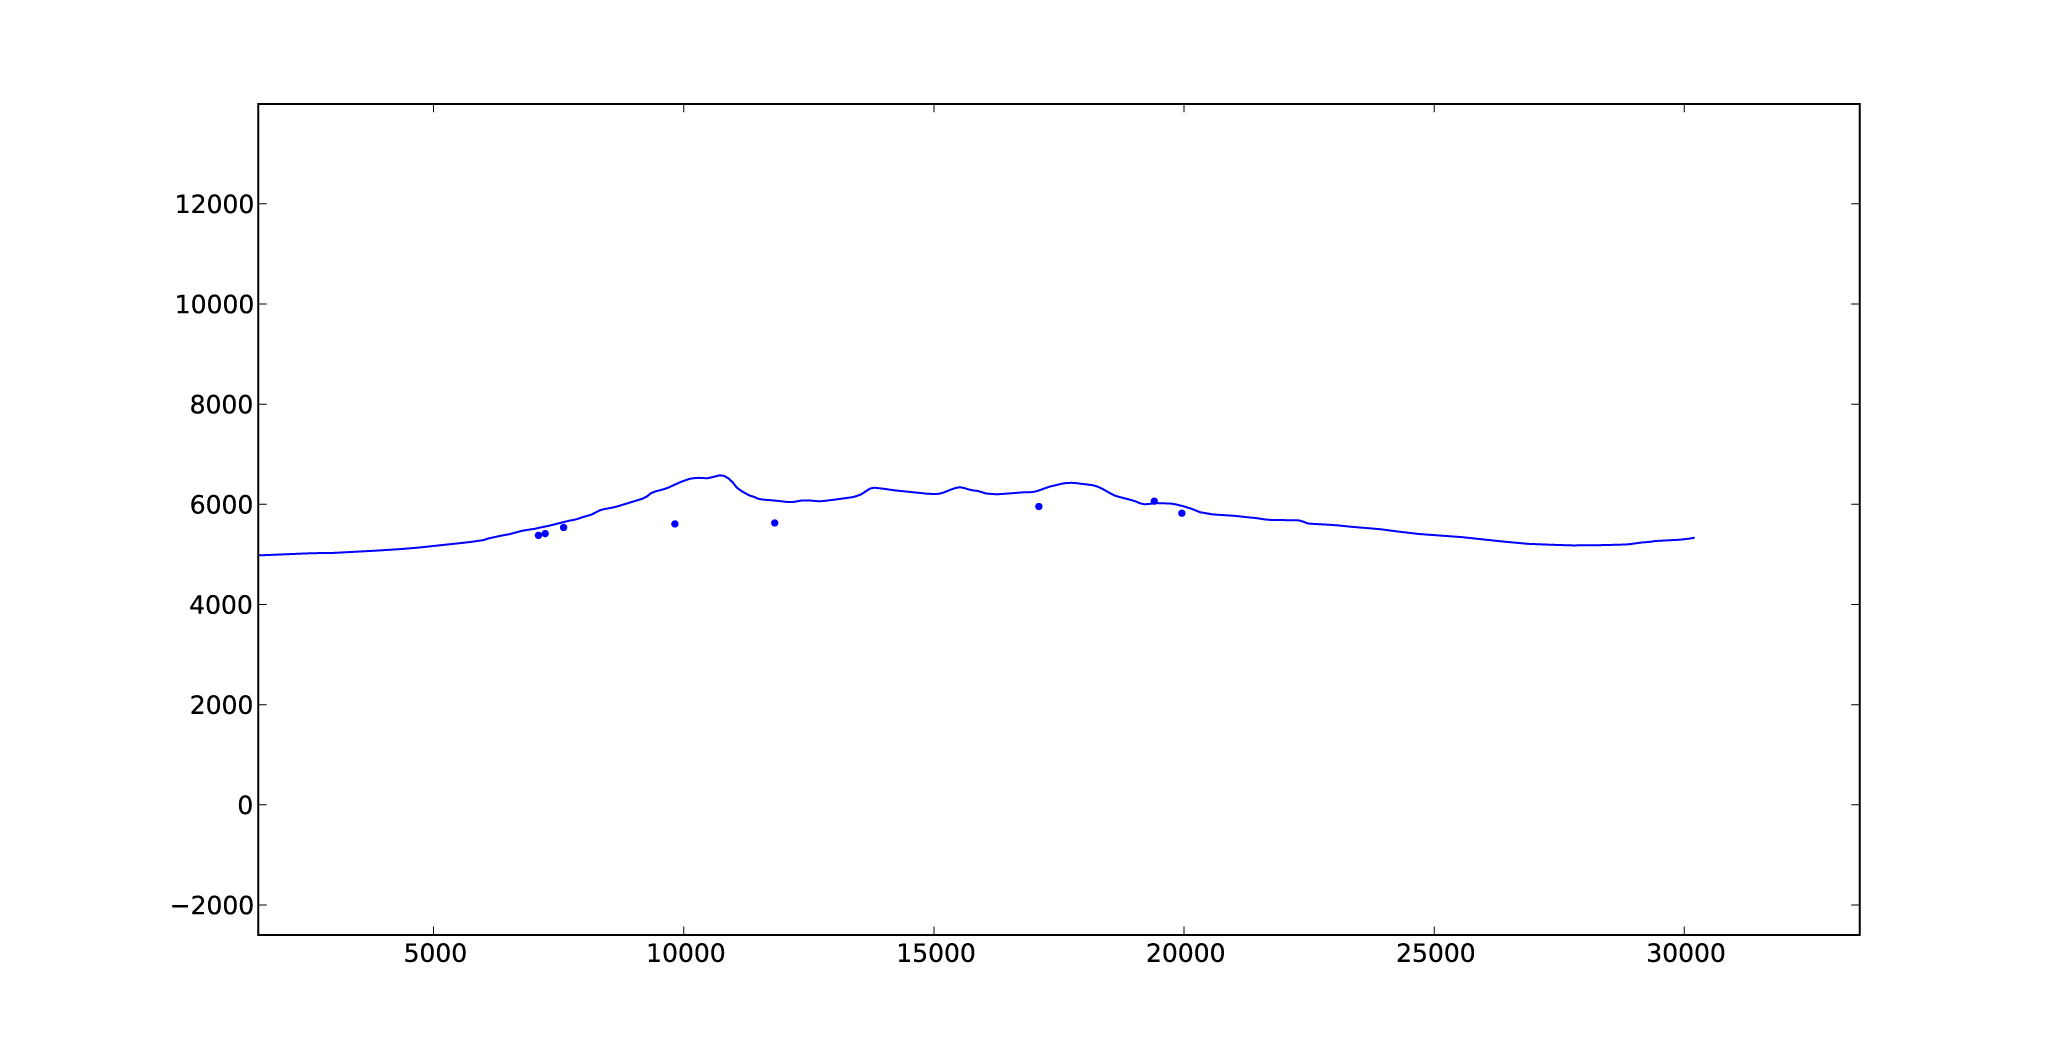
# plot topo profile and samples with no vertical exaggeration
plt.figure(1)
plt.plot(xDist, elev, xDistSample, elevSample, ‘b.’)
plt.axis(‘equal’)
plt.show()
This gives me this: